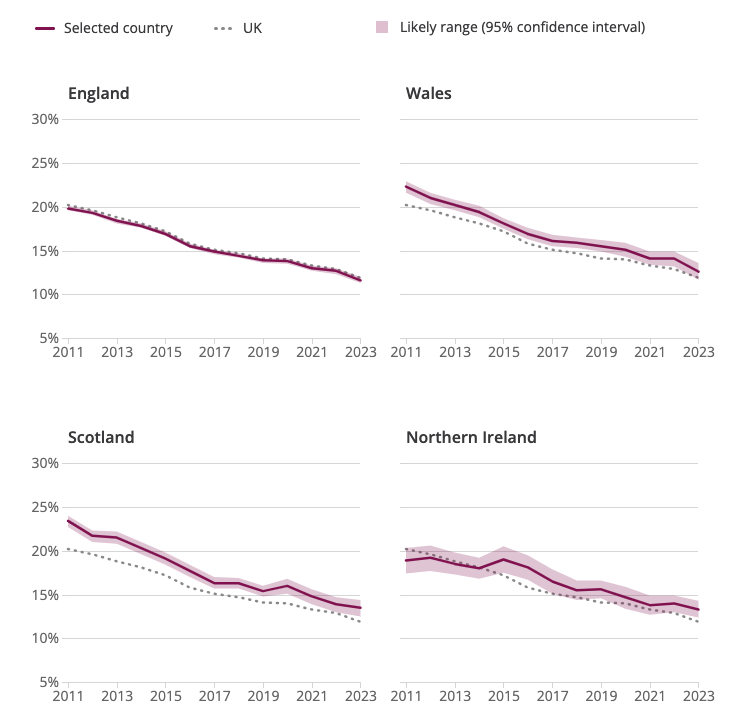
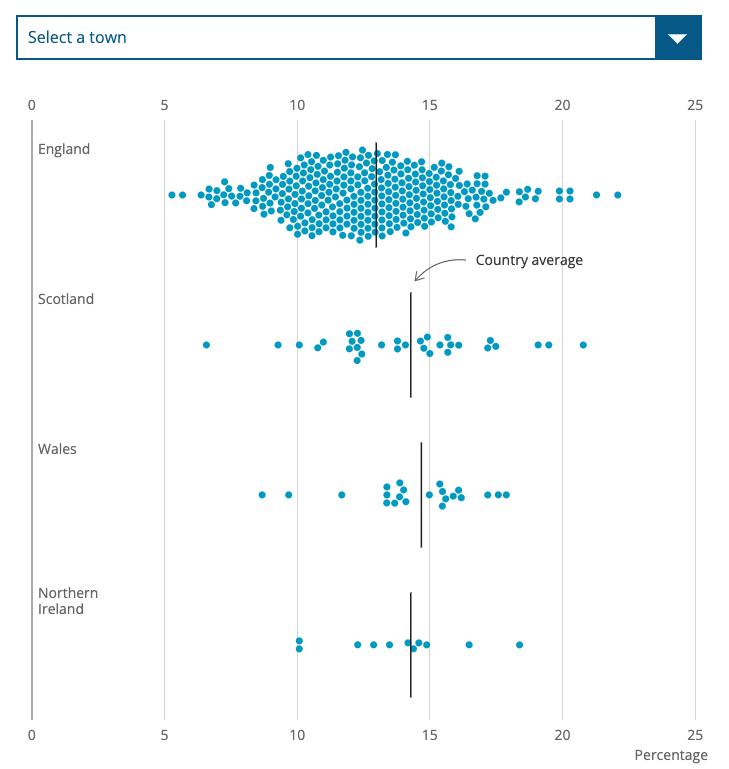
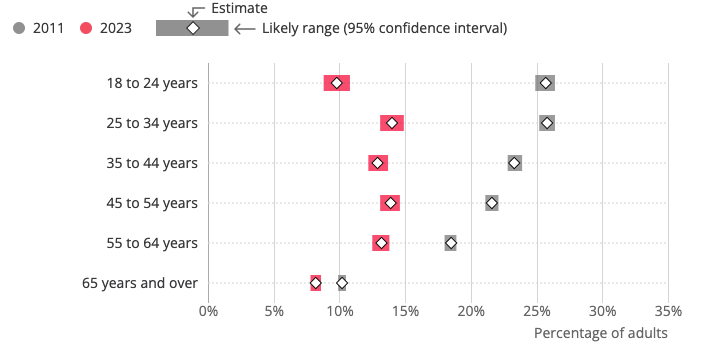
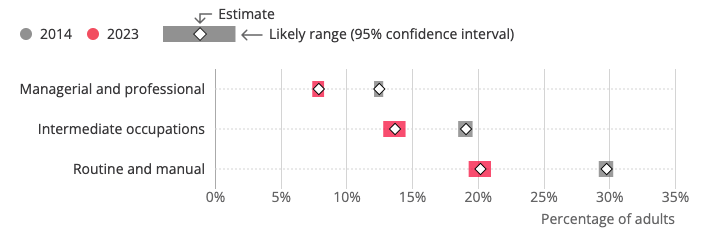
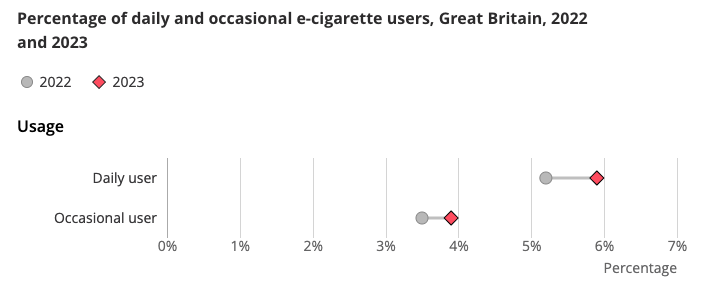
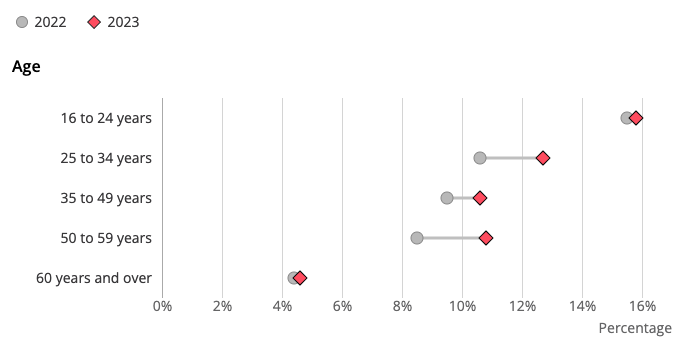
Cigarette smoking habits among adults in the UK, including how many people smoke, differences between population groups, changes over time and use of e-cigarettes.
Release date : 1 October 2024 Next release : To be announced
people smoked cigarettes (aged 18 and above) in the UK in 2023
25 to 34 age
highest propotion of current smokers (14%)
5.1 million
adults aged 16 years and over uses an e-cigatette daily or occasionally
Main points
Around 6.0 million people aged 18 years and over (11.9%) smoked cigarettes in the UK in 2023; this is the lowest proportion of current smokers since records began in 2011, based on our estimates from the Annual Population Survey (APS).
Those aged 25 to 34 years had the highest proportion of current smokers (14.0%) in the UK in 2023.
Those aged 18 to 24 years have had the largest reduction in smoking prevalence (15.9 percentage points) between 2011 (25.7%) and 2023 (9.8%).
Around 5.1 million adults aged 16 years and over (9.8%) currently use an e-cigarette daily or occasionally in Great Britain in 2023, based on the Opinions and Lifestyle Survey (OPN).
E-cigarette use was highest among people aged 16 to 24 years in Great Britain, with 15.8% using e-cigarettes either daily or occasionally.
Using and interpreting the statistics in this release
The Office for National Statistics (ONS) collects data on adult smoking habits through two main surveys. The Annual Population Survey (APS) gives headline indicators of the number of adults aged 18 years and over who smoke in the UK. The Opinions and Lifestyle Survey (OPN) collects information on e-cigarette use among those aged 16 years and over in Great Britain (excluding Northern Ireland), as well as smoking habits and the intention to quit smoking.
Read more about these surveys in Quality and methods.
The following guide explains what you can and cannot do when interpreting and using the statistics in this release.
You can
Find smoking estimates, all of which fall within a range (or confidence interval) that shows the level of uncertainty around the estimate.
Compare trends over time, but be aware that some declines, especially during 2020, could be because of sample sizes and methods changes.
Examine trends in smoking habits by local authority, but we advise focusing on longer-term trends because short-term trends can vary more.
You cannot
Compare smoking in the UK, from the Annual Population Survey (APS), with smoking and vaping in Great Britain, from the Opinions and Lifestyle Survey (OPN); the surveys cover different geographical areas and define a current smoker differently.
Find more information on the statistics in this release in Quality and methods.
Further detail on our data collection and analysis methods is available in our methodology article.
Smoking in the UK and constituent countries
The Annual Population Survey (APS) gives headline indicators on the number of adults aged 18 years and over who smoke in the UK. In this survey, a smoker is defined as someone who smokes nowadays.
The estimated proportion of people who smoke in the UK has been falling since Annual Population Survey (APS) records began in 2011.
In 2023, 11.9% of adults aged 18 years or over (6.0 million people) were current smokers, according to APS data.
This is a decrease from 2022 (12.9% of the population), although not a statistically significant one.
An increase or decrease is statistically significant if it is likely that chance, or the variable nature of the samples, did not cause it. However, this decrease follows a long-term downward trend. The proportion of current smokers has fallen by 8.3 percentage points since 2011 (20.2% of the population).
The APS provides the official measure of smoking prevalence in England. It is used to monitor progress towards the UK government’s target of achieving a smokefree England by 2030, with smoking prevalence at 5% or lower.
Smoking in England, Wales, Scotland and Northern Ireland
In the UK in 2023, as shown in Figure 1, the percentage of adult smokers in:
England was 11.6%
Wales was 12.6%
Scotland was 13.5%
Nortern Ireland was 13.3%
Current smokers as a percentage of all persons aged 18 years and over, 2011to 2023
Figure 1: Smoking prevalence continued to fall in all countries of the UK in 2023
Source - Annual Population Survey from the Office for National StatisticsDownload Figure 1 data:
We have weighted the figures to account for methodological changes in 2020, and to ensure users can compare estimates for 2020 onwards with estimates for previous years.
For Northern Ireland, the estimate over time has been more variable because of the smaller sample size.
Local authority smoking prevalence
Current smoker estimates for each local authority (Figure 2) can vary a lot from year to year
because of small sample sizes. So, we have used a five-year average to give a clearer picture of
how smoking prevalence varies between local authority areas, rather than focusing on one year’s figures.
You can still find annual smoking estimates by local authority in our accompanying Smoking habits in the UK and its constituent countries dataset.
Local authorities with the highest average percentage of current smokers are:
Fenland with 22.1%
Blackpool with 21.3%
Local authorities with the lowest average percentage of current smokers are:
Woking with 5.3%
St Albans with 5.7%%
!Important Information
Smoking prevalence estimates by local authority area are based on smaller sample sizes,
and therefore fluctuate more each year than national-level estimates. So, we have used a
five-year average to compare smoking prevalence between local authority areas.
Percentage who were current smokers, all people aged 18 years and over by local authority, UK 2019 to 2023
Figure 2: The average percentage of current smokers by local authority of the UK
Source - Annual Population Survey from the Office for National StatisticsDownload Figure 2 data:
The averages presented are 5-year rolling averages, calculated using data from 2019 to 2023, where available.
The 5-year rolling estimates have ranges of uncertainty (confidence intervals), which can be found in the accompanying data download.
North Northamptonshire and West Northamptonshire averages are based on a 2-year average (2022 and 2023), because of boundary changes.
City of London and Buckinghamshire Unitary Authority averages are based on a 3-year average (2021 to 2023), because of boundary changes.
Official smoking prevalence estimates for Wales, Scotland and Northern Ireland should be taken from devolved health or national surveys.
Percentage of smokers by age, sex and other personal characteristics
Men were more likely to smoke than women in the UK in 2023, as seen in previous years. Around 3.4 million men (13.7%) and around 2.6 million women (10.1%) reported being current smokers.
When considering the population by age (Figure 3):
those aged 25 to 34 years were most likely to smoke (14.0%)
those aged 65 years and over were least likely to smoke (8.2%)
those aged 18 to 24 years have seen the largest reduction in smoking prevalence between 2011 (25.7%) and 2023 (9.8%)
Percentage who were current smokers, all persons by age group, UK, 2011 to 2023
Figure 3: People aged 25 to 34 years continued to have the highest smoking prevalence
Source - Annual Population Survey from the Office for National StatisticsDownload Figure 3 data:
Characteristics of current cigarette smokers in the UK
Smoking prevalence is known to be associated with a variety of characteristics, such as relationship status, education level and socio-economic status.
When looking at smoking prevalence by economic activity status in the UK in 2023, those who were defined as unemployed had a higher proportion of current smokers (19.7%), compared with those who were in paid employment (11.4%) and those who were economically inactive (12.2%).
Of those who were classified as being in a “routine and manual” socio-economic classification, according to the National Statistics Socio-economic Classification (NS-SEC), 20.2% were current smokers, compared with 7.9% of “managerial and professional occupations”. This follows the same trend since data collection began in 2014 (Figure 4).
The percentage who were current smokers by socio-economic status, all persons aged 18 to 64 years, UK, 2014 to 2023
Figure 4: Smoking prevalence continued to be higher in routine and manual occupations than in managerial and professional occupations in 2023
Source - Annual Population Survey from the Office for National StatisticsDownload Figure 4 data:
Socio-economic status is defined using the National Statistics Socio-economic Classification (NS-SEC).
We have restricted the data to those of working age, aged between 18 and 64 years.
Of people who had no qualifications, 27.4% were current smokers in 2023.
This is higher than among those who reported their highest level of education as “Other qualifications”
(21.8%), and those who reported GCSEs as their highest level of education (18.0%). Those who
reported a degree or equivalent as their highest level of education had the lowest percentage of current smokers (5.8%) (Figure 5).
Percentage who were current smokers by highest level of educational attainment, all people aged 18 years and over, UK, 2014 to 2023
Figure 5: The highest percentage of current smokers were among those who reported they had no qualifications
Source - Annual Population Survey from the Office for National StatisticsDownload Figure 5 data:
A wider range of data on the characteristics of cigarette smokers from the APS is available in our accompanying dataset. This includes estimates by:
employment status
relationship status
housing tenure
country of birth
ethinicity
religion
More information on smoking prevalence by socio-economic status can be found in our Deprivation and the impact on smoking prevalence in England and Wales: 2017 to 2021 bulletin.
Quitting smoking
In this section, we describe data from the Opinions and Lifestyle Survey (OPN), which covers adults aged 16 years and over in Great Britain. In the OPN, a smoker is someone who reports smoking cigarettes, even only occasionally.
The percentage of adults in Great Britain aged 16 years and over who said they smoked cigarettes decreased from 11.2% in 2022 to 10.5% in 2023. This continues the downward trend seen since 1974.
This is in-line with the reduction in smoking prevalence seen in the Annual Population Survey (APS), which covers the UK and adults aged 18 years and over.
The percentage of people who indicated that they had previously smoked and had now quit increased to 70.9% in 2023, compared with 69.4% in 2022 (Figure 6).
The percentage of current smokers, and those who had previously smoked and have quit, all people aged 16 years and over, Great Britain, 1974 to 2023
Figure 6: The percentage of previous cigarette smokers who have quit continued to increase
Source - Annual Population Survey from the Office for National StatisticsDownload Figure 6 data:
The percentage of cigarette smokers who have quit is the percentage of all those who said that they have smoked cigarettes regularly who do not currently smoke.
From March 2020, the survey moved to weekly data collection.
From 25 August 2021, the survey moved to fortnightly data collection.
Data are unweighted before 2000. From 2000 onwards, they are weighted.
We collected data on cigarette use every two years before 2000.
Of the people who currently smoked in 2023, 55.9% intended to quit smoking. Almost a quarter of current smokers (23.8%) intended to quit within the next three months.
Current smokers who intended to quit in the next three months were more likely to wait longer to have their first cigarette of the day (Figure 7).
Percentage of current smokers by time waited until first cigarette of the day and intention to quit, Great Britain, 2023
Figure 7: Current smokers who intended to quit in the next three months waited longer to have their first cigarette of the day
Source - Opinions and Lifestyle Survey from the Office for National StatisticsDownload Figure 7 data:
E-cigarette use has continued to increase most substantially among younger people aged 25 to 34 years.
The percentage of men aged 25 to 34 years who were daily e-cigarette users rose to 10.2% in 2023, from 7.4% in 2022. However, this increase was not statistically significant.
Of women aged 16 to 24 years, 8.7% were daily e-cigarette users in 2023. This is the highest usage recorded in this group since data collection began in 2014. While the increase between 2022 and 2023 was not statistically significant, it follows a large increase between 2021 and 2022 (4.8 percentage points).
Data on adult smoking habits
Smoking habits in the UK and its constituent countries
Dataset | Released 1 October 2024
Annual data on the proportion of adults who currently smoke, the proportion of
ex-smokers and proportion of those who have never smoked, by sex and age.
E-cigarette use in Great Britain
Dataset | Released 1 October 2024
Annual data on the proportion of adults in Great Britain who use e-cigarettes,
by different characteristics such as age, sex and cigarette smoking status.
E-cigarette use in England
Dataset | Released 1 October 2024
Annual data on the proportion of adults in England who use e-cigarettes,
by different characteristics such as age, sex and cigarette smoking status.
Adult smoking habits in Great Britain
Dataset | Released 1 October 2024
Annual data on the proportion of adults in Great Britain who smoke cigarettes,
cigarette consumption, the proportion who have never smoked cigarettes and the
proportion of smokers who have quit, by sex and age over time.
Adult smoking habits in England
Dataset | Released 1 October 2024
Annual data on the proportion of adults in England who smoke cigarettes,
cigarette consumption, the proportion who have never smoked cigarettes and the
proportion of smokers who have quit, by sex and age over time.
Definitions
Cigarette smokers who have quit
The Opinions and Lifestyle Survey (OPN) defines cigarette smokers who have quit as those who said they have smoked cigarettes regularly, but do not currently smoke. This is provided as a proportion of those who have ever smoked cigarettes regularly.
Current cigarette smokers
The Annual Population Survey (APS) defines current cigarette smokers as those who said they smoke cigarettes nowadays. The OPN defines current cigarette smokers as those who said they smoked cigarettes, even if occasionally. Current cigarette smokers are provided as a proportion of those in the population.
Current e-cigarette users
In this release, we discuss both deaths "involving" a particular cause, and deaths "due to" a particular cause. Those "involving" a cause include all deaths that had the cause mentioned on the death certificate, whether as the underlying or a contributory cause. Deaths "due to" a particular cause refer to the underlying cause of death.
Economic activity
We use the International Labour Organization (ILO) definitions of economic activity. Unemployed people are those who are not currently in work but who are looking for work. The group “economically inactive” contains those who are not in work, and not looking for work; this includes retired people and students. More information on economic activity can be found in our Labour Force Survey user guide.
Sampling and non-sampling error
The people who respond to the survey may differ from the population because of random sampling
(sampling error), or because of other factors, for example, because some could not be contacted or
refused to participate (non-sampling error). These non-random effects can lead to sample bias if
they are not full adjusted for through weighting.
Statistical significance
Statistical significance has been determined using 95% confidence intervals. This provides the
range of values that we are 95% confident the true value lies within. The 95% confidence intervals
for the estimates are available in our accompanying datasets. We have deemed two estimates to be
statistically different from one another if their confidence intervals do not overlap. One limitation
of this approach is that some pairs of estimates that are statistically different from one another
will not be identified as such.
Survey mode
Survey mode is the method that is used to collect information from respondents.
There are different types of survey mode, such as face-to-face, telephone, online and mixed mode.
Quality and methods
The Annual Population Survey (APS) has a large sample size and provides data on smoking habits in the UK for those aged 18 and over.
The Opinions and Lifestyle Survey (OPN) has a smaller sample and covers smoking and e-cigarette use in Great Britain for those aged 16 and over.
The APS’s large sample allows reliable statistics for small areas. Survey weights improve population representation, and datasets include confidence intervals to show sampling variability.
In 2020, the coronavirus (COVID-19) pandemic shifted APS data collection to telephone-only.
The OPN also became a weekly survey, focusing on pandemic-related questions and fewer on smoking and
vaping. These changes made estimates less comparable with previous years.
Accredited official statistics
These accredited official statistics were independently reviewed by the Office for Statistics Regulation in February 2013.
They comply with the standards of trustworthiness, quality and value in the Code of Practice for Statistics and should be
labelled "accredited official statistics".
Other statistics producers also publish data on adult smoking habits. We have labelled them as highly, broadly and not comparable with ONS data.
This is to understand if you can compare or combine them with ONS data.
Highly
You can directly compare or combine these data with ONS data.
This is because the data sources and definitions that the statistics producer
used are the same, or almost the same, as those we used.
National Survey for Wales: April 2022 to March 2023
Welsh Government
Highly
You can directly compare or combine these data with ONS data.
This is because the data sources and definitions that the statistics producer
used are the same, or almost the same, as those we used.
The Scottish Health Survey 2022
Scottish Government
Not
You cannot compare or combine these data with ONS data because the data sources or
definitions or both are entirely different to those we used.
Health Survey for England
NHS England
Broadly
You can compare or combine these data with ONS data. However, there are a few
differences in the data sources or definitions or both that the statistics producer
used. This could affect how you use or interpret any compared or combined statistics.
Impact that the coronavirus (COVID-19) pandemic has had on data collection, how this has influenced estimates of smoking prevalence and the comparability of these estimates.