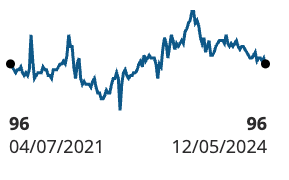
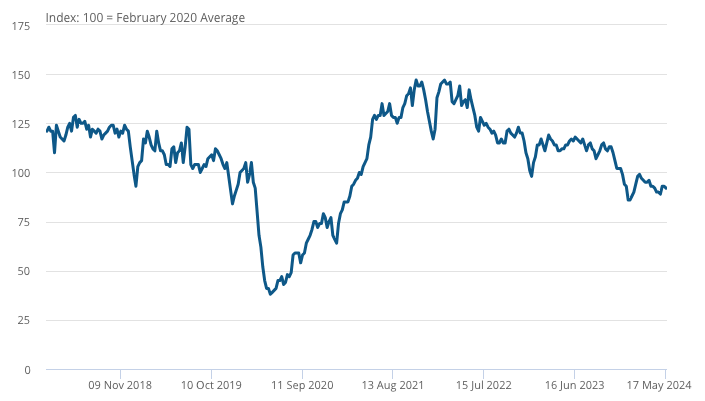
Index of debit card spending on staple seasonally adjusted
Last updated : 5 June 2024
Next update : 12 June 2024
These are official statistics in development, and we advise caution when using the data. The data sources used to compile these indicators are regularly reviewed to ensure they are representative and relevant, which may mean indicators change at short notice
Retail footfall increased by 7% in the week leading up to June 2, 2024, compared to the previous week, due to the May bank holiday and school half term. However, it remained about the same as the equivalent week in 2023 (MRI OnLocation).
Last updated : 2 May 2024
Index of debit card spending on staple seasonally adjusted
Last week
1.0%Last year
-0.2%Last updated : 3 June 2024
Revolut debit card spending by age group, preceding seven day rolling average, non seasonally adjusted
Last week
-1ppLast year
3ppLast updated : 28 Apr 2024
Automative fuel spending insights, non seasonally adjusted, 100 = equivalent week of the previous year
Last week
0.2%Last year
-0.2%Last updated : 3 June 2024
Volume of daily retail footfall
Last week
3%Last year
-1%Last updated : Feb 2024
Direct debit failure rate, seasonally adjusted, UK
Last week
-1%Last year
1%Last updated : Feb 2024
Average transaction amount, seasonally adjusted, UK
Last week
0.2%Last year
-1%Last updated : Feb 2024
Chart subheading goes here
Notes
On May 3, 2024, the total number of online job adverts decreased by 4% from the previous week and was 17% below the same period in 2021 (Adzuna).
Last week
4%Last year
-17%Last updated : Feb 2024
Volume of online job alerts, non seasonally adjusted
Last week
3%Last year
-15%Last updated : Feb 2024
Chart subheading goes here
In the week leading up to May 5, 2024, the System Price of electricity fell by 12% after two weeks of increases, while the System Average Price (SAP) of gas rose by 3% compared to the previous week. Both were higher than the same week in 2023, by 9% and 40%, respectively (Elexon, National Gas Transmission).
Last week
3%Last year
40%Last updated : 5 May 2024
Chart subheading goes here
Last week
-12%Last year
9%Last updated : 5 May 2024
System Price of electricity, pence per kilowatt hour, preceding seven day rolling average, Great Britain, non seasonally adjusted
Last week
-11%Last year
-3%Last updated : 9 May 2024
Weekly number of New Dwelling Energy Performance Certificates lodged on the Register, non seasonally adjusted, England & Wales
Last week
-17%Last year
-1%Last updated : 9 May 2024
Weekly number of existing dwelling Energy Performance Certificates lodged on the Register, non seasonally adjusted England & Wales
Last week
1ppLast year
-2ppLast updated : 28 Apr 2024
Chart subheading goes here
Last week
0.2ppLast year
1ppLast updated : April 2024
Chart subheading goes here
The daily average number of UK flights increased by 2% in the week leading up to June 2, 2024, and was 6% higher than the same week in 2023 (Eurocontrol).
Last week
2%Last year
6%Last updated : April 2024
Chart subheading goes here
Last week
0.2Last year
-2%Last updated : April 2024
Chart subheading goes here
View all publications related to this topic
All indicators and data should be read in conjuction with the publications.
A real-time indicator provides insights into economic activity using close-to-real-time big data, administrative data sources, rapid response surveys or experimental estimates, which represent useful economic and social concepts.
These statistics are labelled as “official statistics in development”. Until September 2023, these were called “experimental statistics”. Read more about the change in our Guide to official statistics in development.
We are developing how we collect and produce the data to improve the quality of these statistics. Read more in our Economic activity and social change in the UK, real-time indicators methodology article. Once the developments are complete, we will review the statistics with the Statistics Head of Profession.
We will decide whether the statistics are of sufficient quality and value to be published as official statistics, or whether further development is needed. Production may be stopped if they are not of sufficient quality or value. Users will be informed of the outcome and any changes. We value your feedback on these statistics. Contact us at realtime.indicators@ons.gov.uk.